Unity's Mono problem: Why your C# code runs slower than it should

Execution of C# code in Unity’s Mono runtime is slow by today’s standards, much slower than you might expect! Our game runs 2-3x faster on modern .NET compared to Unity’s Mono, and in a few small benchmarks I measured speedups of up to 15x. I’ve spent some time investigating what’s going on and in this article I will present my findings and why everyone should want Unity’s .NET modernization to become production-ready as soon as possible.
How did we get here
Unity uses the Mono framework to run C# programs and back in 2006 it was one of the only viable multi-platform implementations of .NET. Mono is also open-source, allowing Unity to do some tweaks to better suit game development.
An interesting twist happened nearly 10 years later. In 2014, Microsoft began open-sourcing .NET (notably .NET Core later that year) and in June 2016, .NET Core 1.0 shipped with official cross-platform support. Since then, the .NET ecosystem gained momentum and lots of improvements have been made, including the Roslyn compiler platform, a new JIT (just-in-time compiler), performance improvements, more features, etc.
In 2018, Unity engineers discussed that they are working on porting the engine to .NET CoreCLR, the multi-platform version of Common Language Runtime (CLR), a component that runs .NET programs. Their main motivations behind this project were performance and convergence. In their post they said:
...CoreCLR could be great for Unity game developers, as it will provide a significant boost in performance, by an order of 2x to 5x compare to the Mono runtime sometimes up to x10 on some workload!
Unfortunately, now it’s the end of 2025 and we still can’t run games on CoreCLR.
The performance gap
We don’t hear about the performance gap between Mono and .NET much, likely because it is not possible to run games written for Unity under modern .NET. But we can still do a direct comparison with code that does not depend on Unity directly.
Our game has a unique architecture – we strictly separate the game simulation code (business logic) from rendering. So much so that the simulation code does not depend on Unity’s libraries and can be compiled and run under any .NET version.
One day I was debugging an issue in map generation and it was time-consuming because it was taking over 2 minutes to start a game. To make debugging faster, I’ve written a unit test, hoping to cut down on the turn-around time since Unity takes 15+ seconds just to crunch new DLLs and reload the domain before the game can be launched and it also initializes rendering stuff that I did not care about. When I ran the test, it finished in 40 seconds. I was quite surprised that it was more than 3x faster, so I started digging deeper.
Long story short, Figure 1 shows traces from a profiler showing the difference between the game launching in Unity running under Mono vs. a unit test running under .NET.
Note that all shown benchmarks are using either Unity 6.0 or .NET 10.
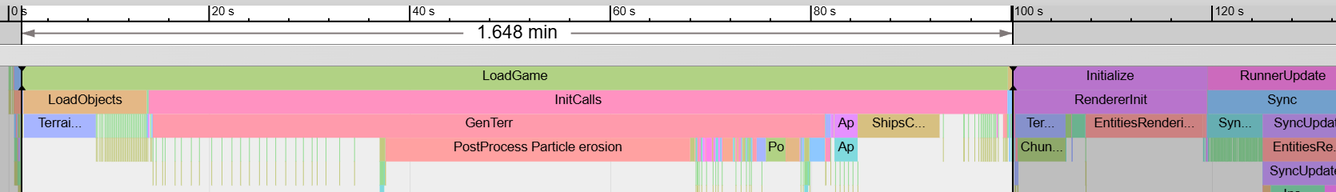
Unity editor compiled in Debug mode: 100 seconds. 
.NET unit test compiled in Debug mode: 38 seconds.


So our benchmark shows that loading a save file, generating a map, and initializing the simulation takes 100 seconds in Unity/Mono but only 38 seconds in .NET. This result alone is already something that may raise eyebrows and has real consequences of how you may want to approach debugging and testing.
I also know from experience with Unity that Release mode running as a standalone executable (without the Unity editor) is much faster, so I decided to test that next.
.NET vs. Mono in standalone Release mode
Debug mode slowness is not great, but even non-optimized C++ code can be slow. To compare the real performance gap between Mono and .NET, let’s run the same benchmark as above but in release mode, standalone executable.
First up: Unity. I’ve run our deploy script to get an optimized executable and run it directly. Unsurprisingly, optimized standalone executable is beating Unity editor by a big margin, more than 3x faster. Next, the same code running under .NET in Release mode. Figure 2 shows the results.

Mono as standalone executable compiled in Release mode: 30 seconds. 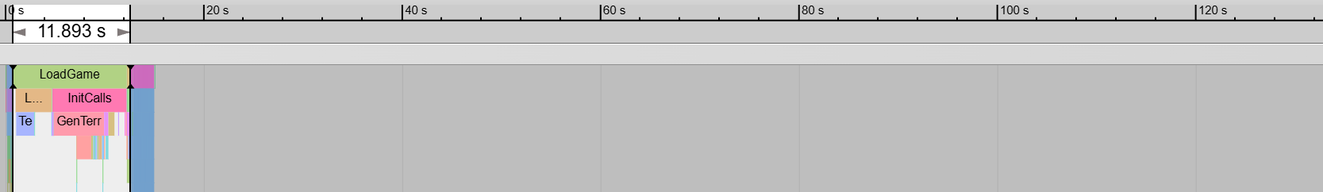
.NET unit test compiled in Release mode: 12 seconds.


Yep. 12 seconds. It’s actually mind-boggling how much work is being done in these 12 seconds and when I saw this for the first time, I was not only shocked, but also impressed. Just so you know, a 4k × 4k map is being generated using all available threads out of hundreds of combined noise functions in like 3 seconds. Figure 3 shows the trace expanded.
 Figure 3: The expanded trace of the 12-second run from above. The blue boxes after the highlighted area is the actual unit test, stepping the game.
If you are interested in seeing the actual x86 assembly generated by Mono and .NET JITs, see the Extras section at the end of this article.
Conclusion
As you can see from the presented benchmarks, Mono is massively behind .NET in terms of performance. This is primarily due to differences in runtime optimizations and JIT that generates unoptimized assembly. The actual speedup surely depends on the code itself, but from my research, 1.5-3x speedup of C# execution is very likely for most projects.
If you are a game developer using Unity, or even a player, you can now understand that CoreCLR would be a massive boost to performance of games and even the Unity editor. Unfortunately, for the past 8 years, Unity leadership was more interested in “other things” and did not give .NET modernization the attention it deserves.
Some view .NET modernization as support for new language features in C#, but that is just a cherry on top. New C# adds some handy features, but the new JIT can deliver multi-x speedups.
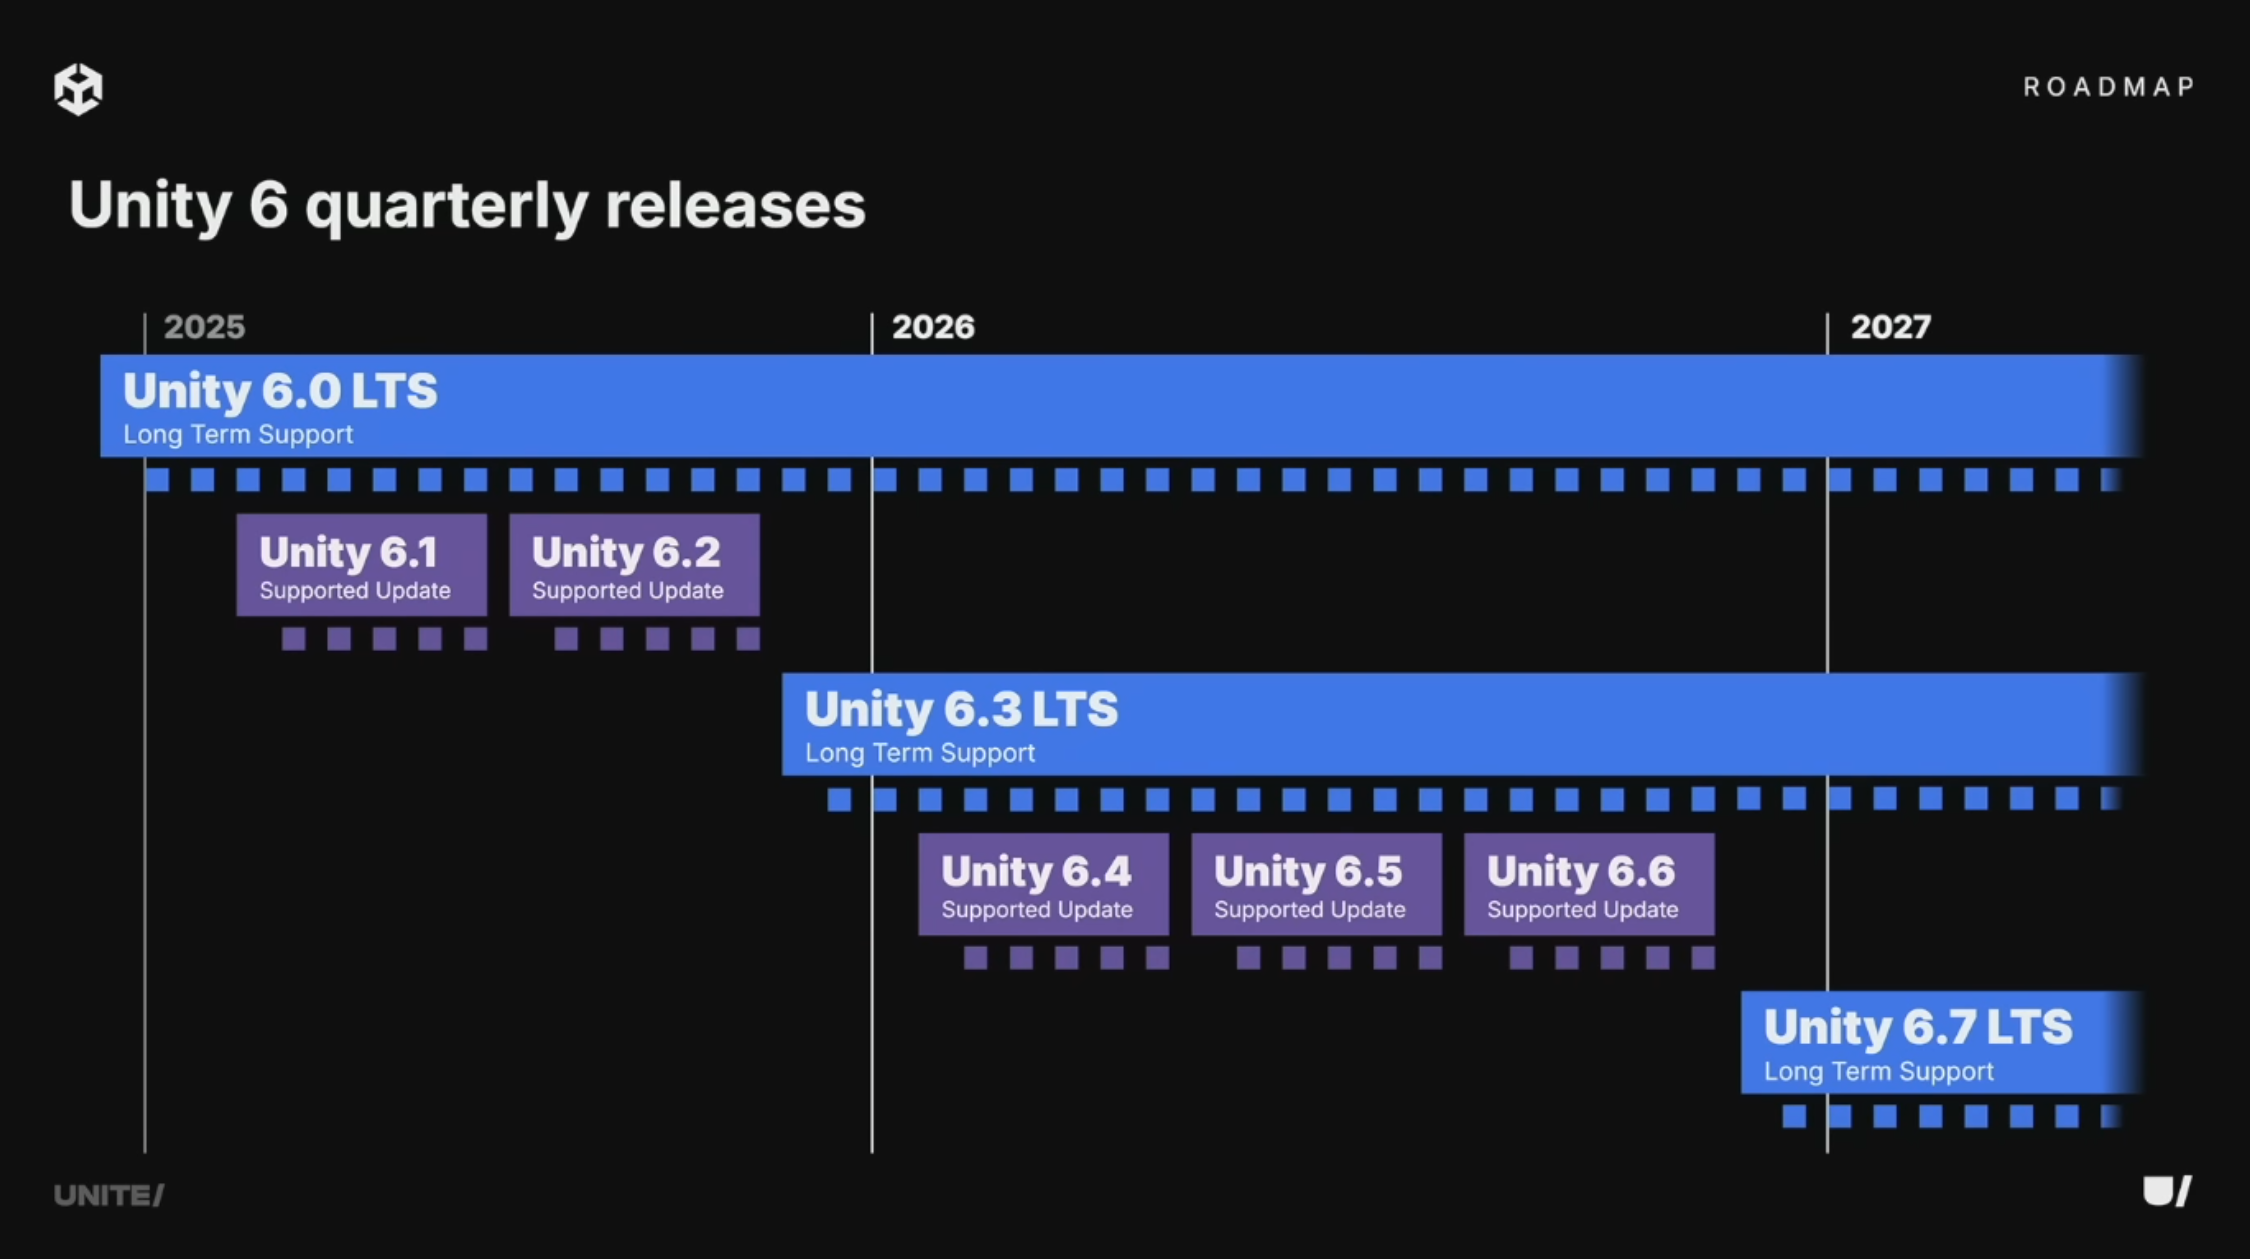
At this year's Unite conference, Unity announced that CoreCLR is still ongoing but it won’t be production ready in 2026. The good news is that it now seems to be on the Unity 6.x roadmap, and not left for later versions as suggested by 2024’s Unite presentation.
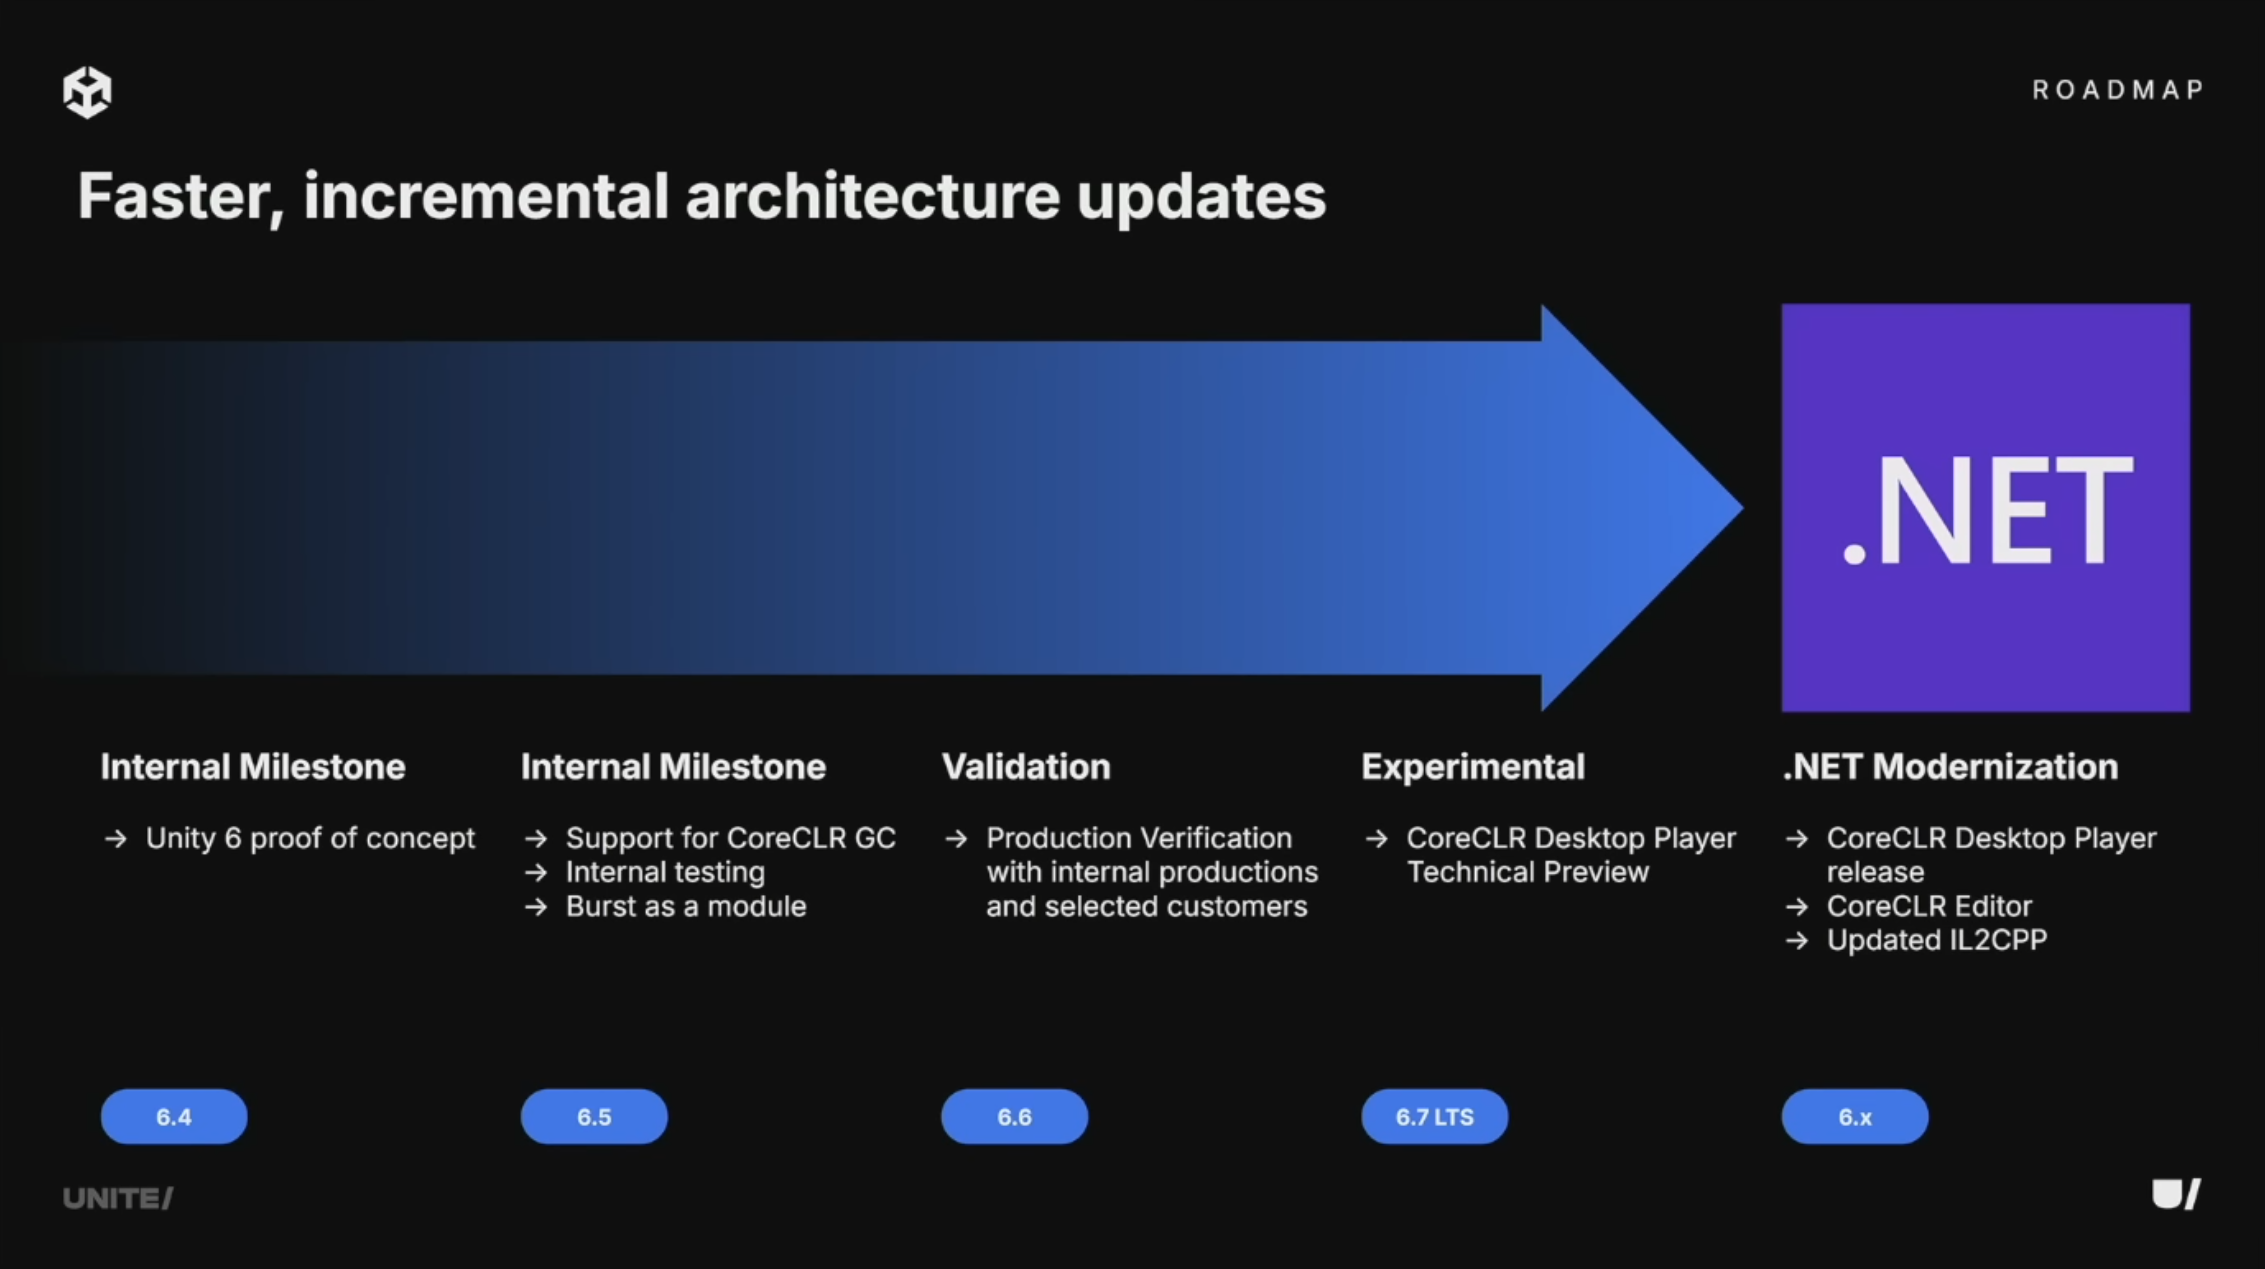
Moreover, CoreCLR is not just new JIT and C#, it unlocks broader and better-optimized support for things like Span<T>-style APIs, hardware intrinsics, and newer SIMD paths that devs cannot use these days. These features could add another multiplier to the performance gains for some classes of code. For example, our map generator heavily uses 2D and 3D simplex noise. I bet that having access to new runtime features in CoreCLR could speed up the map generation by another 2x.
Unity has a technology called Burst that automatically converts marked C# methods to optimized native assembly via the LLVM compiler. This sounds neat as it can avoid the poor JIT performance, but the downside is that Burst has strict limitations on what can be converted and supports only subset of C#. I believe that CoreCLR with modern JIT will have very similar performance characteristics to Burst. I am curious what would happen in a universe where Unity invested all the time and effort in CoreCLR support and high-performance C#, instead of developing and maintaining Burst.
Another interesting consequence of CoreCLR support is the ability to pre-compile the .NET intermediate assembly to machine code using ahead-of-time compilation (AOT). AOT can further improve startup time and is essential on platforms where JIT is restricted (notably iOS). Nowadays, Unity solves this with IL2CPP that takes the intermediate code and compiles it to C++ which is then optimized and compiled to native assembly. However, according to RichardFine (Unity staff), using CoreCLR AOT is not planned and IL2CPP is here to stay:
AOT for IL2CPP is completely independent of AOT for CoreCLR (which we have no plans to adopt anyway). GC behaviour on IL2CPP improves when we upgrade the GC there, it’s not really affected by CoreCLR at all.
In conclusion, CoreCLR won’t magically fix every bottleneck in a Unity game, but it does fix many of the code generation inefficiencies and allows writing higher-performance code. The benchmark presented in this article is meant to illustrate that modern .NET has spent years squeezing more work into fewer CPU cycles, and Unity users are largely locked out of those gains today.
If Unity can deliver production-ready CoreCLR support, it won’t just mean “newer C#”. It will mean faster runtime performance, faster iteration times, more performance headroom, no domain reload, better GC behavior, and maybe even more managed code and less native code. Until then, the gap will remain an invisible tax on every Unity project that leans on managed code.
I’m cheering for you, Unity devs, CoreCLR for the win!

Extras: Comparison of x86 assembly
I have actually dug much deeper into the performance aspects of Mono vs .NET but for the sake of this article not being too long, here is a brief summary.
Code listing 1 shows the testing code. It does some basic summing of custom structs that are wrappers around ints. This is an interesting example because Mono is very bad at inlining and simplifying expressions, even obvious ones, and we have plenty of structs like these in our code base (e.g. Quantity, MechPower, Tile2i, etc).
1
2
3
4
5
6
7
8
9
10
11
12
13
14
15
16
17
18
19
20
21
22
23
24
25
26
27
28
29
30
31
32
33
34
35
36
37
38
static class Program {

	static void Main() {
		Console.WriteLine(RunTest(int.MaxValue));
	}

	public static TestStruct RunTest(int iterations) {
		TestStruct value1 = new TestStruct(iterations % 2);
		TestStruct value2 = new TestStruct(iterations % 7);
		TestStruct value3 = new TestStruct(iterations % 13);

		TestStruct result = default;

		for (int i = 0; i < iterations; ++i) {
			result += value1 + value2;
			result += value1 + value3;
		}

		return result;
	}

}

readonly struct TestStruct {

    public readonly int Value;

    public TestStruct(int value) {
        Value = value;
    }

    public static TestStruct operator +(TestStruct lhs, TestStruct rhs) {
        return new TestStruct(lhs.Value + rhs.Value);
    }

    public override string ToString() => Value.ToString();

}
To obtain assembly code, I’ve compiled the code in Release mode and ran it as a standalone executable. Then, I attached a debugger to the running process. An easy way to find this loop was to make it long/infinite and just break the program at any time, it would end up in that loop.
First, let’s take a look at .NET. Here is the x64 assembly of the for-loop section of the code.
1
2
3
4
5
6
7
8
9
10
add r8d,edx
add edx,r10d
00007FFDEC338E88:
    mov  r10d,r8d
    add  r9d,r10d
    mov  r10d,edx
    add  r9d,r10d
    inc  ecx
    cmp  ecx,eax
    jl   00007FFDEC338E88
In both cases, the full loop of int.MaxValue iterations took around 750 ms on my machine.
This looks neat. Even if you don’t read assembly, you can see that there are two add instructions, one decrement, and one jump.
It seems that the JIT hoisted the invariant sums a = value1 + value2 and b = value1 + value3 out of the loop and then just accumulates them.
I also tested x86 assembly, and it looks very similar:
1
2
3
4
5
6
7
082E18D0:
    lea  ebx,[esi+edi]
    add  eax,ebx
    lea  ebx,[esi+edx]
    add  eax,ebx
    dec  ecx
    jne  082E18D0
Interestingly, the loop direction was reversed, counting down. This saves one instruction as comparison to zero and conditional jump can be done as one instruction.
Now let’s look at Mono’s x64 assembly.
1
2
3
4
5
6
7
8
9
10
11
12
13
14
15
16
17
18
19
20
21
22
23
24
25
26
27
28
29
30
31
32
33
34
35
36
37
38
39
40
41
42
43
44
45
46
47
48
49
50
51
52
53
1E87D2F3E20:
    movsxd  rax,dword ptr [rsp+0C0h]
    mov     dword ptr [rsp+40h],eax
    movsxd  rax,dword ptr [rsp+0B8h]
    mov     dword ptr [rsp+38h],eax
    movsxd  rax,dword ptr [rsp+40h]
    mov     dword ptr [rsp+0A0h],eax
    movsxd  rax,dword ptr [rsp+38h]
    mov     dword ptr [rsp+98h],eax
    movsxd  rax,dword ptr [rsp+0A0h]
    movsxd  rcx,dword ptr [rsp+98h]
    add     eax,ecx
    mov     dword ptr [rsp+90h],0
    mov     dword ptr [rsp+90h],eax
    mov     dword ptr [rsp+30h],eax
    movsxd  rax,dword ptr [rsp+0A8h]
    mov     dword ptr [rsp+88h],eax
    movsxd  rax,dword ptr [rsp+30h]
    mov     dword ptr [rsp+80h],eax
    movsxd  rax,dword ptr [rsp+88h]
    movsxd  rcx,dword ptr [rsp+80h]
    add     eax,ecx
    mov     dword ptr [rsp+78h],0
    mov     dword ptr [rsp+78h],eax
    mov     dword ptr [rsp+0A8h],eax
    mov     dword ptr [rsp+28h],eax
    movsxd  rax,dword ptr [rsp+0C0h]
    mov     dword ptr [rsp+20h],eax
    movsxd  rax,dword ptr [rsp+0B0h]
    mov     dword ptr [rsp+18h],eax
    movsxd  rax,dword ptr [rsp+20h]
    mov     dword ptr [rsp+70h],eax
    movsxd  rax,dword ptr [rsp+18h]
    mov     dword ptr [rsp+68h],eax
    movsxd  rax,dword ptr [rsp+70h]
    movsxd  rcx,dword ptr [rsp+68h]
    add     eax,ecx
    mov     dword ptr [rsp+60h],0
    mov     dword ptr [rsp+60h],eax
    mov     dword ptr [rsp+10h],eax
    movsxd  rax,dword ptr [rsp+28h]
    mov     dword ptr [rsp+58h],eax
    movsxd  rax,dword ptr [rsp+10h]
    mov     dword ptr [rsp+50h],eax
    movsxd  rax,dword ptr [rsp+58h]
    movsxd  rcx,dword ptr [rsp+50h]
    add     eax,ecx
    mov     dword ptr [rsp+48h],0
    mov     dword ptr [rsp+48h],eax
    mov     dword ptr [rsp+0A8h],eax
    inc     esi
    cmp     esi,7FFFFFFFh
    jl      1E87D2F3E20
As you can see just from the number of instructions, this code will run way slower.
The full loop of int.MaxValue iterations took around 11500 ms, that’s ~15x slower.
In the assembly you can see the four add instructions in the loop, the “inefficient” increment + comparison + jump (instead of decrement + conditional jump), and most importantly a sea of mov instructions, which are just memory copies from inefficient inlining of the struct fields. Basically Mono is just tossing values around memory.
I have also tested assembly compiled in Debug mode running in the Unity editor and it’s even worse. The full loop takes 67 seconds (67000 ms)! In Unity Editor, the JIT likely switches to far less optimized codegen and includes additional checks/sequence-point overhead, which balloons runtime.
Takeaway: modern .NET’s JIT can scalarize tiny value types and hoist invariant work so the hot loop becomes a handful of register ops, while Mono often fails to do so and ends up shuffling values through memory, exactly the kind of gap that shows up as slowdowns in real simulation-heavy code.