Realtime visualization of 3D vector fields using CUDA
Chapter 2: Visualization using glyphs
Glyph is some marker, such as an arrow or line, used to visualize vector field (in our case). Visualization using glyphs is the easiest type of visualization and I did two types, lines and arrows. Both techniques are described in following subsections.
Line glyphs for VF visualization
Lines visualization is very simple implement. For every point in given plane computes a line with orientation matching vector field in given point and length of line and color is given by vector magnitude (flow intensity).
Code listing 6 shows (simplified) kernel which computed lines in YZ plane. X axis is the only degree of freedom of this visualization and can be controlled by user. It might seems like a limitation but it is enough for dataset of delta-wing where air flow follow x-axis.
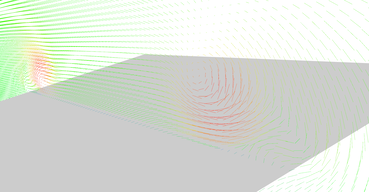
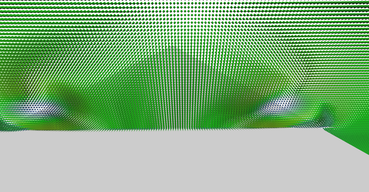
Results of this visualization are shown in Figure 4. As you can see, it is quite hard to "read" this visualization. Lines are not shaded which makes very hard to see line orientation in space. This visualization is also ambiguous because you cannot tell correct length and direction of the line. The color scale helps to distinguish lines and line length. In the application itself situation is a little bit better because you can move camera round and see lines orientations and lengths more easily as well as smoothly move the plane with line glyphs on x-axis.
1
2
3
4
5
6
7
8
9
10
11
12
13
14
15
16
17
18
19
20
21
22
__global__ void glyphLinesKernel(float x, uint2 glyphsCount,
		float2 worldSize, float3* outVertices, float3* outColors) {

	uint id = __umul24(blockIdx.x, blockDim.x) + threadIdx.x;
	uint totalCount = __umul24(glyphsCount.x, glyphsCount.y);
	if (id >= totalCount) {
		return;
	}

	float y = (id % glyphsCount.x) * (worldSize.x / glyphsCount.x);
	float z = (id / glyphsCount.x) * (worldSize.y / glyphsCount.y);
	float4 vector = tex3D(vectorFieldTex, x, y, z);

	id *= 2;
	outVertices[id] = make_float3(x, y, z);
	outVertices[id + 1] = make_float3(x, y, z)
		+ normalize(make_float3(vector.x, vector.y, vector.z)) * vector.w;

	float4 color = tex1D(vectorMangitudeCtfTex, vector.w);
	outColors[id] = make_float3(color.x, color.y, color.z);
	outColors[id + 1] = make_float3(color.x, color.y, color.z);
}
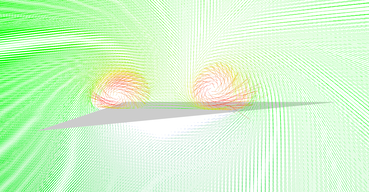
Line glyphs reveals two vortices above the sides of the wing. 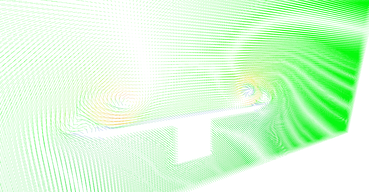
Line glyphs near the end of the wing - main vortices are weaker and you may notice very small secondary vortices. 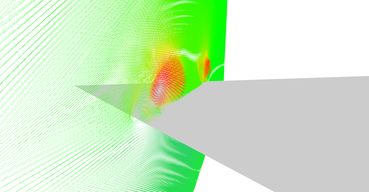
Detail on primary and secondary vertices above the sides of the wing. 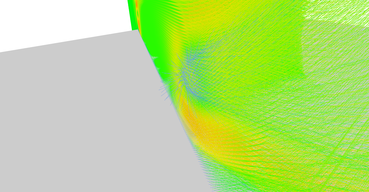
Detail on recirculation bubble where wind goes even backwards.
Performance of this visualization is very good because every CUDA thread has to compute just two points. Computation time for nearly any amount of glyphs is less than 20 ms which makes the exploration very responsive and intuitive.
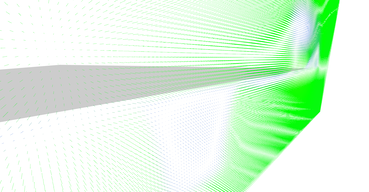
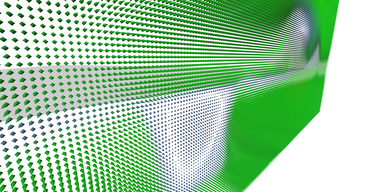
It is possible to set number of glyph lines in plane to very high numbers and create solid wall as shown in Figure 5. This serves as relatively nice visualization of vector magnitudes.
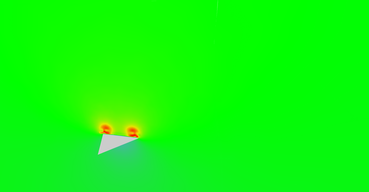
High density line glyphs plane effectively visualizing magnitude field. Plane is just behind the front of the wing. 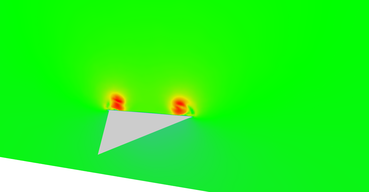
Vector field magnitudes near the middle of the wing. 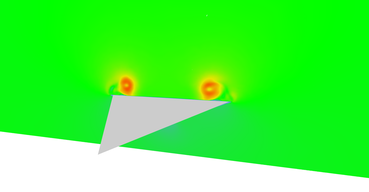
Vector field magnitudes near the middle of the wing. 
Vector field magnitudes near the end of the wing. 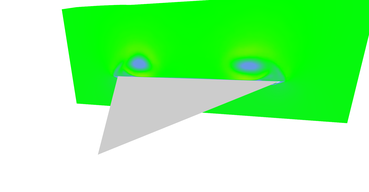
Vector field magnitudes near the end of the wing. 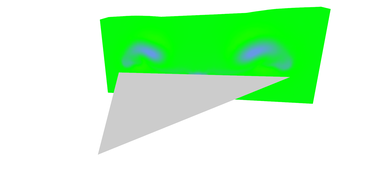
Vector field magnitudes just behind the wing. 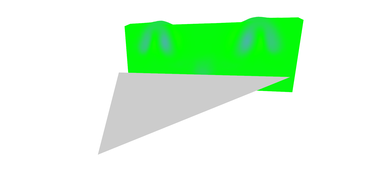
Vector field magnitudes further behind the wing. 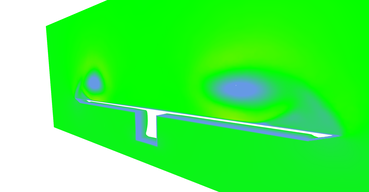
Vector field magnitudes near the end of the wing. Wing itself is not shows which reveals box under the wing. Notice that wind is slower near the surface of the wing.
Arrow glyphs for VF visualization
As we saw, lines visualization is very ambiguous. Arrows helps to remove those ambiguities. Orientation is distinguished by arrow itself and because arrow has triangular faces, it can be shaded according to light and thus seen in 3D more clearly.
Code listing 7 shows (simplified) kernel for computation arrow glyphs. Interesting fact about this kernel is that it computes vertices, normals and indices for all arrows. This makes the code quite lengthy but is also makes the computation and display blazingly fast. Thanks to usage of shared VBOs there is no CPU-GPU data transfer.
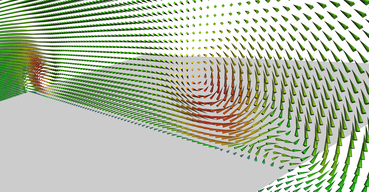
Arrows are much larger than lines thus, we need less of them and it makes the computation roughly 2x faster than lines (about 10 ms). Results of this visualization are shown in Figure 6. In the application it is possible to adjust density and size of arrow glyphs as well as smoothly move with the plane where glyphs are.
1
2
3
4
5
6
7
8
9
10
11
12
13
14
15
16
17
18
19
20
21
22
23
24
25
26
27
28
29
30
31
32
33
34
35
36
37
38
39
40
41
42
43
44
45
46
47
48
49
50
51
52
53
__global__ void glyphArrowsKernel(float x, uint2 glyphsCount,
		float2 worldSize, float3* outVertices, uint3* outFaces,
		float3* outVertexNormals, float3* outVertexColors) {

	uint id = __umul24(blockIdx.x, blockDim.x) + threadIdx.x;
	// ... same part as in lines kernel ...
	float4 vector = tex3D(vectorFieldTex, x, y, z);
	float3 forward = normalize(make_float3(vector.x, vector.y, vector.z));
	float3 xAxis = normalize(findPerpendicular(forward));
	float3 yAxis = normalize(cross(forward, xAxis));

	uint faceId = id * 6;
	uint vertId = id * 9;

	outFaces[faceId] = make_uint3(vertId, vertId + 1, vertId + 2);
	outFaces[faceId + 1] = make_uint3(vertId, vertId + 2, vertId + 3);
	outFaces[faceId + 2] = make_uint3(vertId, vertId + 3, vertId + 4);
	outFaces[faceId + 3] = make_uint3(vertId, vertId + 4, vertId + 1);
	outFaces[faceId + 4] = make_uint3(vertId + 5, vertId + 6, vertId + 7);
	outFaces[faceId + 5] = make_uint3(vertId + 5, vertId + 7, vertId + 8);

	id *= 9;
	outVertexNormals[id] = forward;
	outVertexNormals[id + 1] = xAxis;
	outVertexNormals[id + 2] = yAxis;
	outVertexNormals[id + 3] = -xAxis;
	outVertexNormals[id + 4] = -yAxis;
	forward *= -1;
	outVertexNormals[id + 5] = forward;
	outVertexNormals[id + 6] = forward;
	outVertexNormals[id + 7] = forward;
	outVertexNormals[id + 8] = forward;

	forward *= vector.w;
	xAxis *= 0.1;
	yAxis *= 0.1;

	outVertices[id] = position - forward;  // Forward was multiplied by -1.
	outVertices[id + 1] = position + xAxis;
	outVertices[id + 2] = position + yAxis;
	outVertices[id + 3] = position - xAxis;
	outVertices[id + 4] = position - yAxis;
	outVertices[id + 5] = position + xAxis;
	outVertices[id + 6] = position + yAxis;
	outVertices[id + 7] = position - xAxis;
	outVertices[id + 8] = position - yAxis;

	float4 color = tex1D(vectorMangitudeCtfTex, vector.w);
	float3 color3 = make_float3(color.x, color.y, color.z);
	for (int i = 0; i < 9; ++i) {
		outVertexColors[id + i] = color3;
	}
}
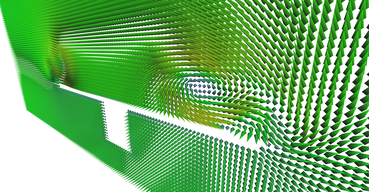
Vector field visualization using arrow glyphs near the end of the wing. 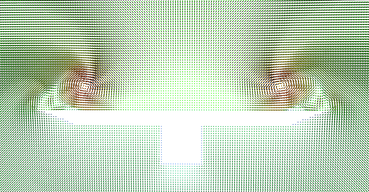
Front view of glyphs plane going through the middle of the wing. Notice secondary vortices under the primary ones. 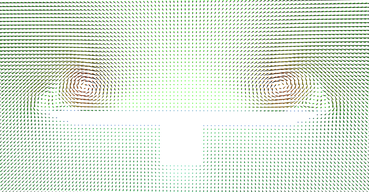
Lower density of arrow glyphs. 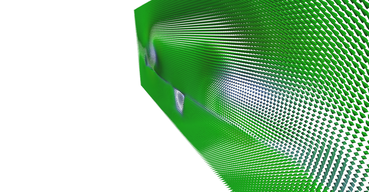
Glyphs plane just behind the delta-wing. 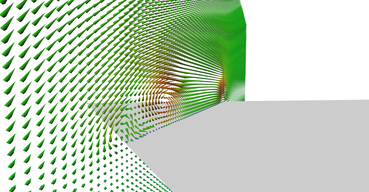
Another view on glyph plane from the back. 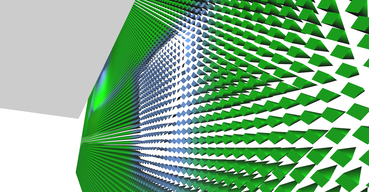
Detail on the area behind the aerodynamic box of the wing where air is going in the opposite direction (the box is not shown).
Line vs. arrow glyphs
Figure 7 shows side-by side comparison of line and arrow glyphs. This nicely shows that arrows do much better job in vector field visualization. However, there are better techniques how to visualize vector fields which are discussed in following sections.
